How to Leverage Call Reporting to Make Your Company Successful
If you’re looking to leverage your call center analytics, there are a few things you’ll want to consider. Firstly, it’s most important to know what you want to get from your data. Are you in a call center? Do you want to figure out your top agent’s secret sauce? Or maybe you’re a manager of many accounts and want to see why some are no longer performing.Data is an extremely powerful tool, but the question is, how much data do you need and how can you leverage that data to tell a story? When you’re looking at a big spreadsheet, it’s easy to get lost and confused on where to even start. However, once you figure out how to get started it becomes a lot easier. All you need to do is decide which criteria is most important in helping you complete your goal. Once you’ve understood that, now the question becomes: what criteria are you looking for? Are you looking to improve your conversion rate? Are you looking to know why your calls are being dropped? There are ways to figure out why these situations happen which allows you to make changes that will improve overall performance.
To start, what is call reporting? The real short of it is that Call Reporting is another way of saying a “data report” that, if used correctly, can help grow a company, help find out sore spots, and even find points of opportunity. Now why is call reporting important and why should you use it? Firstly, call reporting will let you know where your calls are going. I know that sounds like it should be common sense, but, sometimes, even something as basic as that can be a big help in finding issues especially when you manage a plethora of phone numbers and call centers. Additionally, call reporting can be used to find improvements, items that need to be fixed, and even the winners and losers of the company. Some might be common knowledge, but others may not be as well known.
Call reporting is useful for anyone at the call center level, all away up to the CEO and owners of the company. At the call center level, you can know who the best buyers are, what regions have the most success, the times that people are most likely to buy, and more. Now at the CEO level, it can be used to see how much money is being made, what call centers are performing the best, what to peruse next to earn more money, or even what to cut to stop losing money. When presenting data to higher-ups, it’s important to ensure the key data points are visible and easily accessible to those who aren’t as well versed in data or spreadsheets. Highlighting always helps to make the data you want someone to see stand out. You can even go as far as to take out irrelevant data so people don’t get confused, overloaded, or stuck on non-relevant numbers.
Now the real question is how can you successfully analyze a call report? Well the first thing to consider is how much data do you get? Do you have basic call information ( Call Start Time, From Number, To Number, Duration) or do you have every part of the call with the NPA, NPX information, if the person called in on a Cell Phone or a Landline, where the person called in from, etc. You may have included other data that is only related to your business process, i.e. If the call is within your peak hours which could be a Boolean field (T/F), what the call earned and cost you, and more! If you’re like many of us you’re probably wondering what’s the best way to present this data and deep dive into it? There’s always the possibility that you have backend access to the data you receive that is not available on a GUI, if you can correctly extract this from the Database you can have fun playing with and learning from it. Be sure to know what you want to show and present before you get your data together so you don’t end up chasing loose ends.
Here are a few examples of how you can leverage the data you do have. Of course, you can use your data visualization tool of choice. Here we will be using Excel. Additional tools that you can use to leverage your data, including placing it into dynamic dashboards, are: PowerBI, Tableau, and/or Spotfire. All of these tools try to accomplish the same thing: to put data into a format that the end user can use to gather information easily without having any prior knowledge.
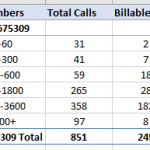
A basic pivot table to show you which phone numbers have the most traffic. Here we have a break out for each number with counts of call duration and if the call resulted in a sale.
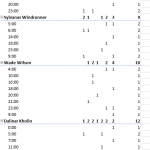
 Agent Performance by day and hour
 As we mentioned in the beginning, when you leverage your data in the correct way you can make it tell a story. Yet even before we start molding the data into a nugget of gold, we first need to do the most important thing: data cleaning. Sometimes, you don’t even have to anything to clean your data and it is ready to go after you download it. However, depending on how your data is stored/downloaded you may have to do some cleaning. For example, you may only have a CallStart field that has both the Date and the Time of the call, but no where else in the report do you just have date and time. So, you must split out the Date and the Time in their own columns. You can either copy and paste the value or use excels formatting tool to change it into a Date and a Time value. There may be other instances of concatenation of data that you may have to modify yourself. Again, every company stores their data differently and that will just depend on how much you must massage your data.
Now, one thing you will need to remember while making reports from call reporting data, is that you might not find anything substantial. It is not uncommon for your data to remain the same as the previous week or weeks. So, don’t let it get you down if you aren’t able to find groundbreaking findings in your initial data. Another thing to remember is Holidays. Sometimes, while working with a lot of data, taking a quick glance and seeing that a numbers performance dropped 50% can be shocking. However, taking stock of national holidays can help you expect a drop, and if you look at the past years data and see you have a similar drop, then you know that the holiday caused that to happen. Another piece of advice is don’t always go chasing every little issue. Spending time on the smaller discrepancies can be a time-waster. For example, if you are used to one phone number sending roughly 30,000 calls a month, and then it drops down to 29500 the next month, that really isn’t a massive change, and I am sure if you look at past data, the number probably has fluctuated each month. Yet, if you see that a number that has receive 500 calls a week, suddenly jumps up to 5000 calls, that would be something that you would want to check out. Then, ask yourself: was this expected? How long are the calls? Did the billable calls increase at a similar rate? For example, if that same number had the 500 calls and 10 billable, and it jumped to 5000 calls and 100 billable. Then you could guess that there was a massive release or posting that caused the increase. But if the billable count went only to 20, then you might have to look into that and see if there was an increase in robocalls, or even if you there was an update pushed on your end and it caused an issued (maybe an IVR issue).
Once you understand everything in call reporting there may still be sometimes that you feel like you’ve tried everything and can’t seem to find out why the data you are using can’t tell that story you want to tell. Firstly, try asking a coworker how they would want to see a report that you want to create. Sometimes those fresh ideas from another person can kickstart you to think in different ways. Secondly, see if there is any way you can get more data from the system. It is possible that where you store your data is in a massive database, and the report you are viewing hasn’t had a column update in years, email whoever has control of the database and maybe schedule a meeting asking if they could create a special view for you with the specific columns you need. Sometimes, all that is wrong is that you are missing important data that you don’t even know you can get and that data is being stored, waiting for you to dive into it.
Now, as we have stated many times, you need to make sure your data tells a story. Granted every report might be different in what story it might tell. Some stories may be uneventful and boring, i.e. a Weekly Report. Others can tell exciting epic adventures i.e. the growth of one of your partners over the years in business with them as you both helped each other grow. I am not saying that the Weekly Report will never become that epic story, because sometimes, in those simple reports, you can find something that leads to the motherload and this is where you can find those problems to fix. At the end of the day, again, make sure you know your audience when crafting reports. For example, you might not want to craft a complex multipage report to a higher-level executive because they might not have the time to look, and they just wanted to get a high-level overview not an in-depth look. Whichever way to choose to look at or manipulate your data, always keep your goal and audience in mind!